woebin_plot create plots of count distribution and positive probability for each bin. The binning informations are generates by woebin.
woebin_plot(bins, x = NULL, title = NULL, show_iv = TRUE,
  line_value = "posprob", ...)
Arguments
- bins
A list of data frames. Binning information generated by
woebin.- x
Name of x variables. Defaults to NULL. If x is NULL, then all columns except y are counted as x variables.
- title
String added to the plot title. Defaults to NULL.
- show_iv
Logical. Defaults to TRUE, which means show information value in the plot title.
- line_value
The value displayed as line. Accepted values are 'posprob' and 'woe'. Defaults to positive probability.
- ...
Additional parameters
Value
A list of binning graphics.
See also
Examples
# Load German credit data
data(germancredit)
# Example I
bins1 = woebin(germancredit, y="creditability", x="credit.amount")
#> ℹ Creating woe binning ...
#> ✔ Binning on 1000 rows and 2 columns in 00:00:00
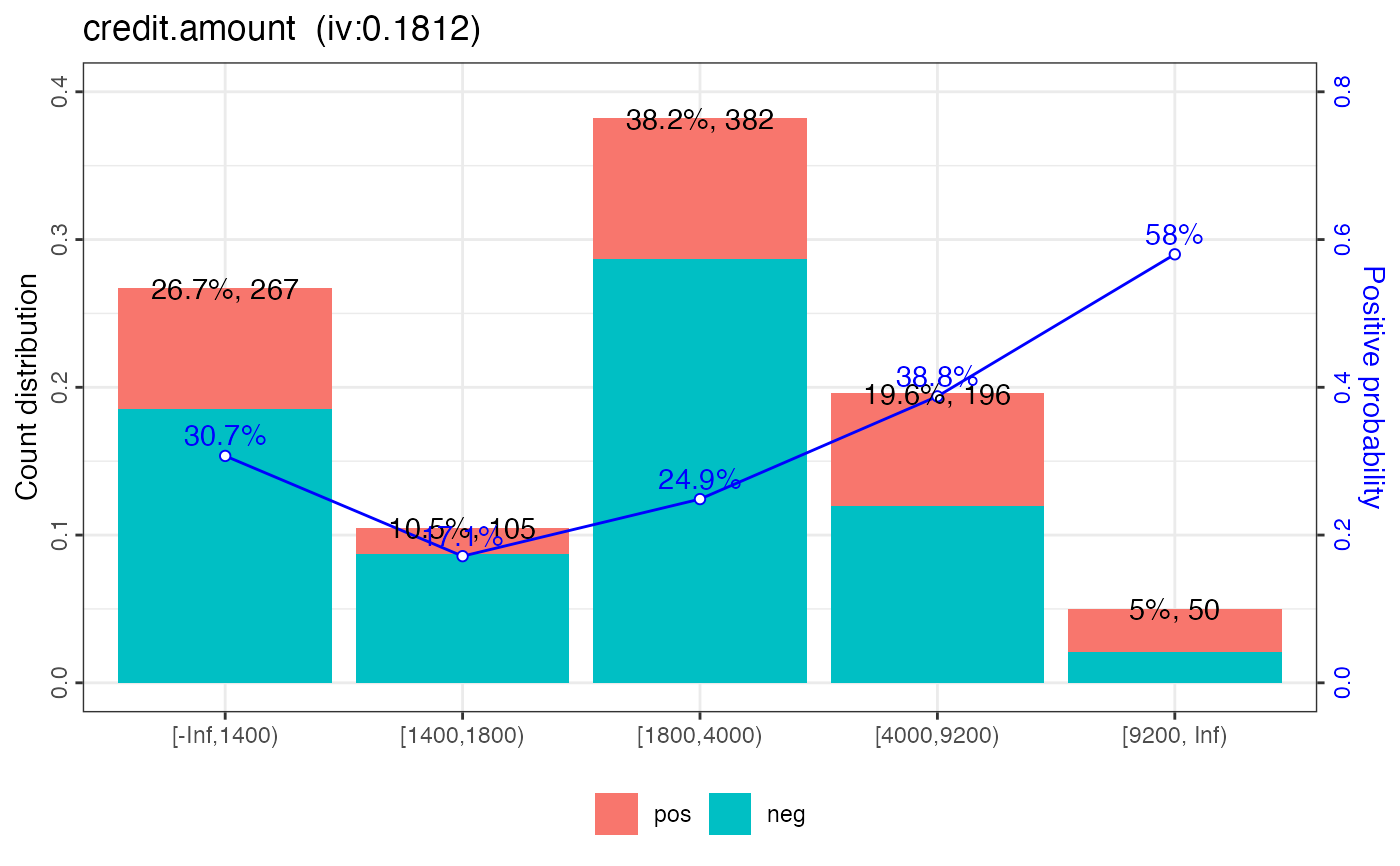
p1 = woebin_plot(bins1)
print(p1)
#> $credit.amount
 #>
# modify line value
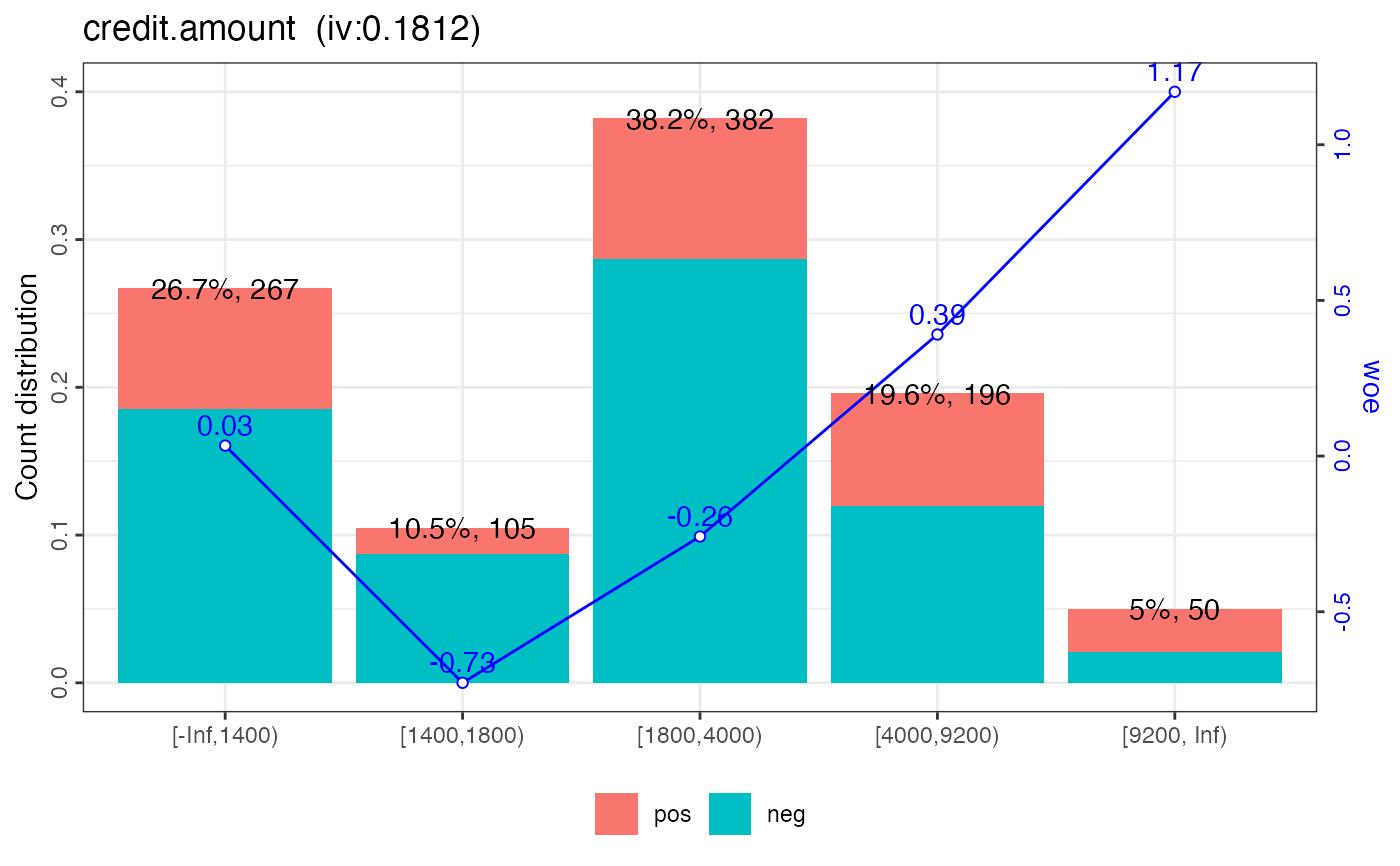
p1_w = woebin_plot(bins1, line_value = 'woe')
print(p1_w)
#> $credit.amount
#>
# modify line value
p1_w = woebin_plot(bins1, line_value = 'woe')
print(p1_w)
#> $credit.amount
 #>
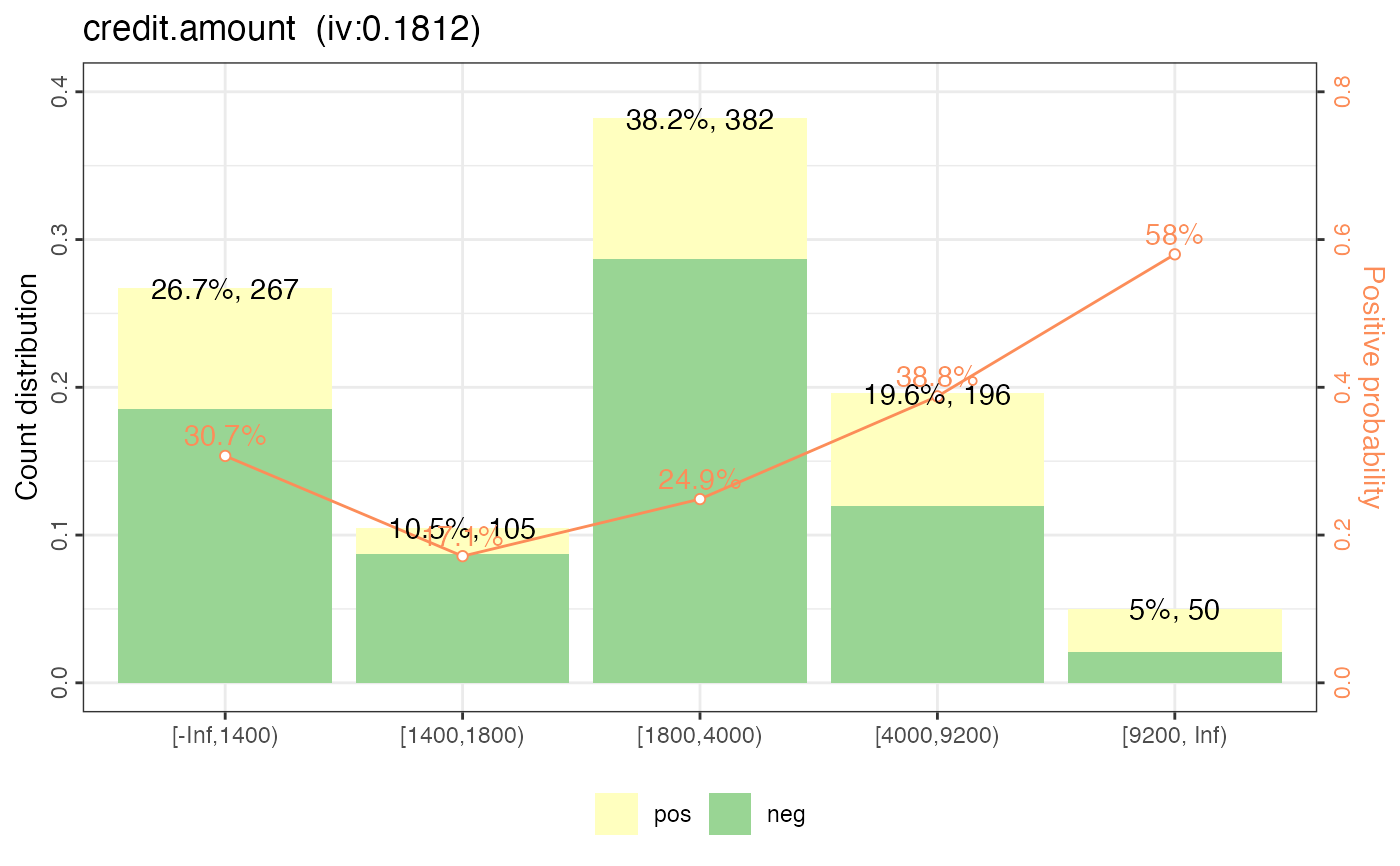
# modify colors
p1_c = woebin_plot(bins1, line_color='#FC8D59', bar_color=c('#FFFFBF', '#99D594'))
print(p1_c)
#> $credit.amount
#>
# modify colors
p1_c = woebin_plot(bins1, line_color='#FC8D59', bar_color=c('#FFFFBF', '#99D594'))
print(p1_c)
#> $credit.amount
 #>
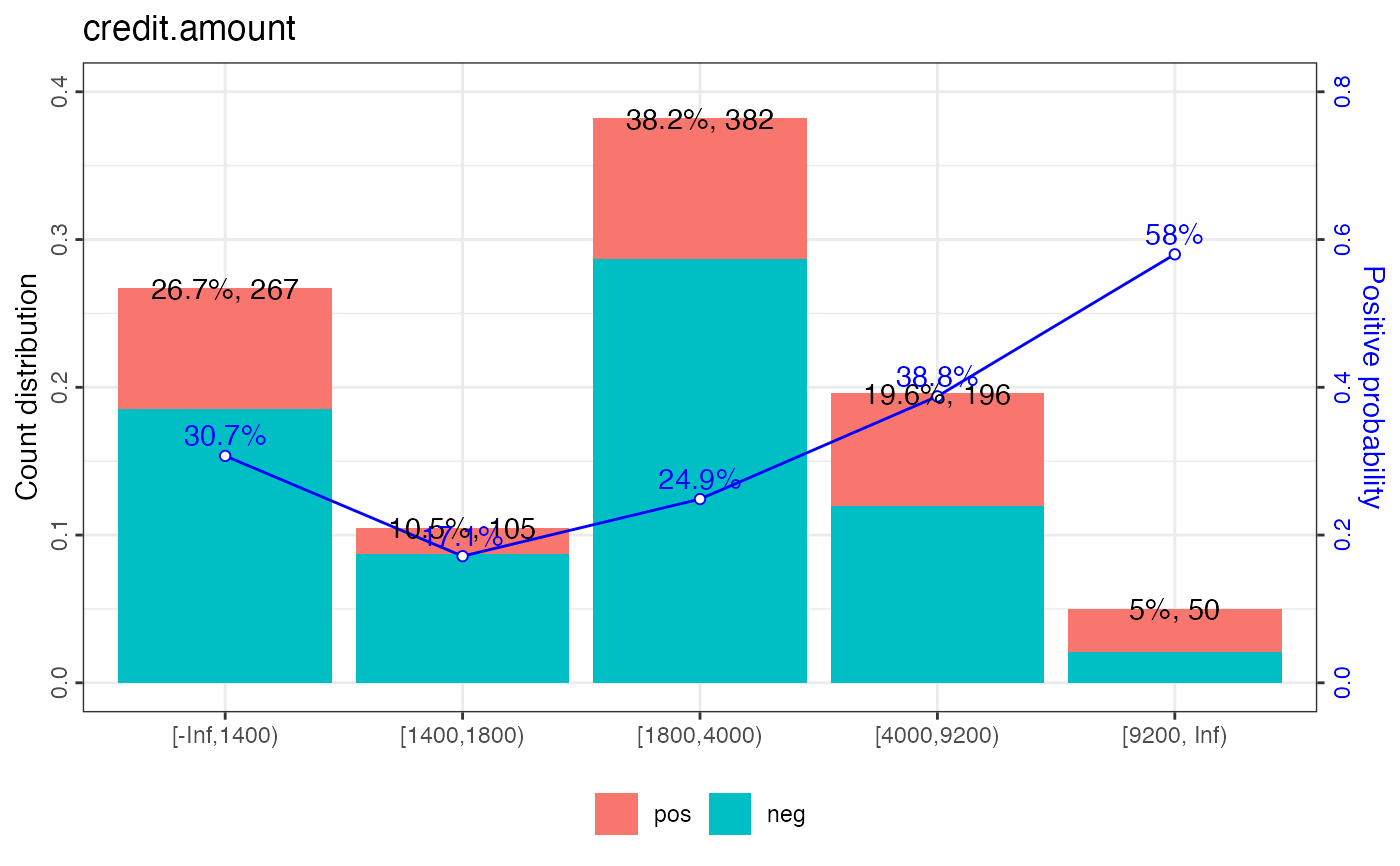
# show iv, line value, bar value
p1_iv = woebin_plot(bins1, show_iv = FALSE)
print(p1_iv)
#> $credit.amount
#>
# show iv, line value, bar value
p1_iv = woebin_plot(bins1, show_iv = FALSE)
print(p1_iv)
#> $credit.amount
 #>
p1_lineval = woebin_plot(bins1, show_lineval = FALSE)
print(p1_lineval)
#> $credit.amount
#>
p1_lineval = woebin_plot(bins1, show_lineval = FALSE)
print(p1_lineval)
#> $credit.amount
 #>
p1_barval = woebin_plot(bins1, show_barval = FALSE)
print(p1_barval)
#> $credit.amount
#>
p1_barval = woebin_plot(bins1, show_barval = FALSE)
print(p1_barval)
#> $credit.amount
 #>
# \donttest{
# Example II
bins = woebin(germancredit, y="creditability")
#> ℹ Creating woe binning ...
#> ✔ Binning on 1000 rows and 21 columns in 00:00:01
plotlist = woebin_plot(bins)
print(plotlist$credit.amount)
#>
# \donttest{
# Example II
bins = woebin(germancredit, y="creditability")
#> ℹ Creating woe binning ...
#> ✔ Binning on 1000 rows and 21 columns in 00:00:01
plotlist = woebin_plot(bins)
print(plotlist$credit.amount)
 # # save binning plot
# for (i in 1:length(plotlist)) {
# ggplot2::ggsave(
# paste0(names(plotlist[i]), ".png"), plotlist[[i]],
# width = 15, height = 9, units="cm" )
# }
# }
# # save binning plot
# for (i in 1:length(plotlist)) {
# ggplot2::ggsave(
# paste0(names(plotlist[i]), ".png"), plotlist[[i]],
# width = 15, height = 9, units="cm" )
# }
# }