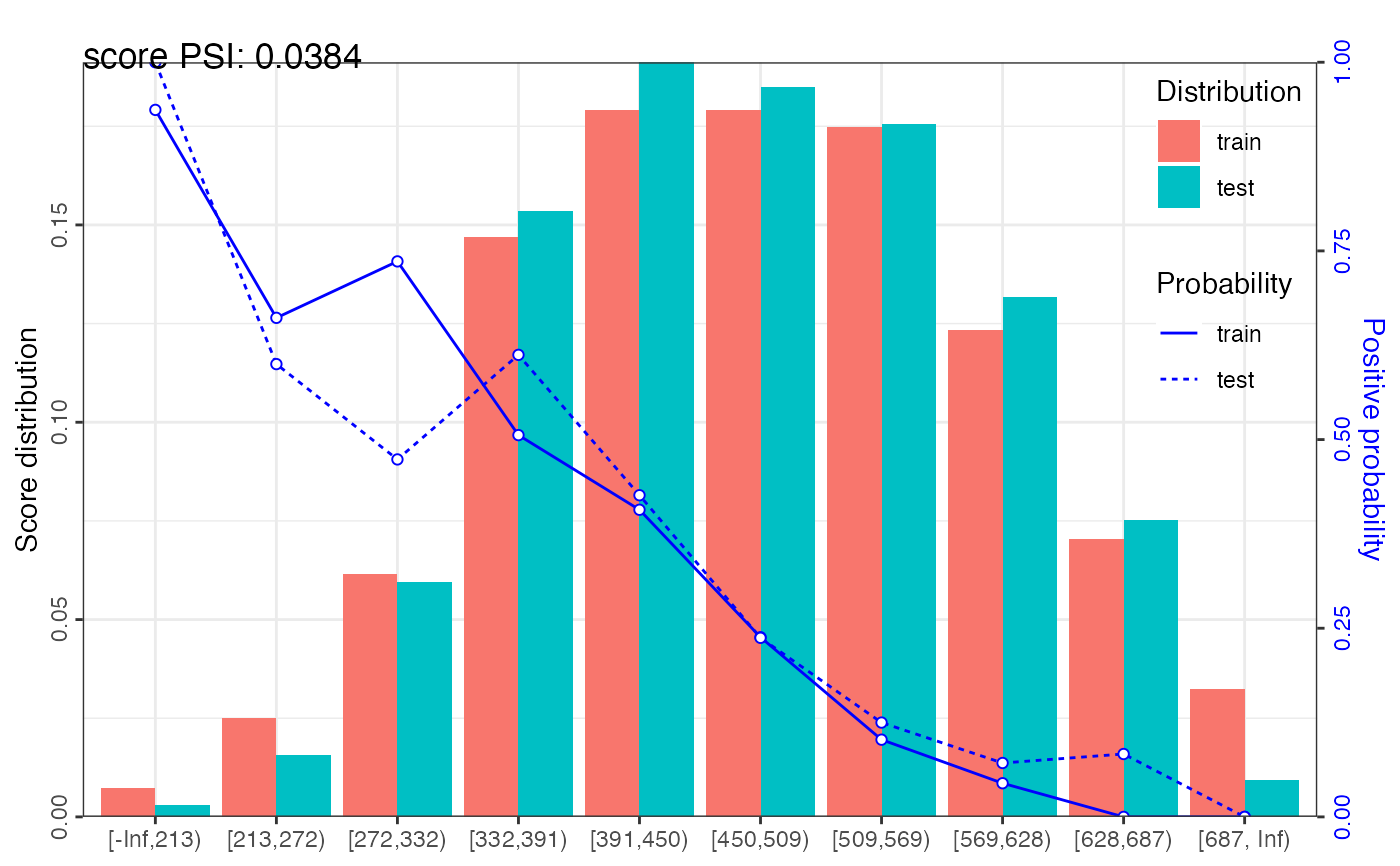
perf_psi calculates population stability index (PSI) for total credit score and Characteristic Stability Index (CSI) for variables. It can also creates graphics to display score distribution and positive rate trends.
perf_psi(score, label = NULL, title = NULL, show_plot = TRUE,
  positive = "bad|1", threshold_variable = 20, var_skip = NULL, ...)
Arguments
- score
A list of credit score for actual and expected data samples. For example, score = list(expect = scoreE, actual = scoreA).
- label
A list of label value for actual and expected data samples. For example, label = list(expect = labelE, actual = labelA). Defaults to NULL.
- title
Title of plot, Defaults to NULL.
- show_plot
Logical. Defaults to TRUE.
- positive
Value of positive class, Defaults to "bad|1".
- threshold_variable
Integer. Defaults to 20. If the number of unique values > threshold_variable, the provided score will be counted as total credit score, otherwise, it is variable score.
- var_skip
Name of variables that are not score, such as id column. It should be the same with the var_kp in scorecard_ply function. Defaults to NULL.
- ...
Additional parameters.
Value
A data frame of psi and graphics of credit score distribution
Details
The population stability index (PSI) formula is displayed below: $$PSI = \sum((Actual\% - Expected\%)*(\ln(\frac{Actual\%}{Expected\%}))).$$ The rule of thumb for the PSI is as follows: Less than 0.1 inference insignificant change, no action required; 0.1 - 0.25 inference some minor change, check other scorecard monitoring metrics; Greater than 0.25 inference major shift in population, need to delve deeper.
Characteristic Stability Index (CSI) formula is displayed below: $$CSI = \sum((Actual\% - Expected\%)*score).$$
See also
Examples
# \donttest{
# load germancredit data
data("germancredit")
# filter variable via missing rate, iv, identical value rate
dtvf = var_filter(germancredit, "creditability")
#> ℹ Filtering variables via missing_rate, identical_rate, info_value ...
#> ✔ 1 variables are removed via identical_rate
#> ✔ 6 variables are removed via info_value
#> ✔ Variable filtering on 1000 rows and 20 columns in 00:00:00
#> ✔ 7 variables are removed in total

# breaking dt into train and test
dt_list = split_df(dtvf, "creditability")
label_list = lapply(dt_list, function(x) x$creditability)

# binning
bins = woebin(dt_list$train, "creditability")
#> ℹ Creating woe binning ...
#> ✔ Binning on 681 rows and 14 columns in 00:00:01
# scorecard
card = scorecard2(bins, dt = dt_list$train, y = 'creditability')

# credit score
score_list = lapply(dt_list, function(x) scorecard_ply(x, card))
# credit score, only_total_score = FALSE
score_list2 = lapply(dt_list, function(x) scorecard_ply(x, card,
  only_total_score=FALSE))


###### perf_psi examples ######
# Example I # only total psi
psi1 = perf_psi(score = score_list, label = label_list)
psi1$psi  # psi data frame
#>    variable    dataset        psi
#>      <char>     <char>      <num>
#> 1:    score train_test 0.03837177
psi1$pic  # pic of score distribution
#> $score

#>
# modify colors
# perf_psi(score = score_list, label = label_list,
#          line_color='#FC8D59', bar_color=c('#FFFFBF', '#99D594'))

# Example II # both total and variable psi
psi2 = perf_psi(score = score_list2, label = label_list)
# psi2$psi  # psi data frame
# psi2$pic  # pic of score distribution

# }